Turning data into knowledge has 3 benefits: It accelerates decision making, saves ad spend and fosters innovation. Learn how to set up reliable and clear campaign analytics that process your campaign data and give you actionable knowledge.
Letting go of underperforming strategies is faster when you’re able to clearly see they’re underperforming. Fixing leaks in your funnel is easier when someone points them out early on.
Keeping a close eye on your sales funnel performance analytics will save you time and ad spend. Data based decisions are revenue-growing decisions. Check your funnel’s performance, before you wreck your funnel’s performance.
Sales Funnel Diagnostics: How to Find out What’s Wrong?
Before you start playing doctor with your sales funnel, let’s look at some most common funnel diseases. The Key Metrics we will be looking at are Visits, Clicks, Leads and Completions.

1. Diagnosis: Low Visits
You can see how many visits you’re getting in Key Metrics, under “Visits”. It shows how many times your funnel was loaded. If your funnel has low visits it’s hard to draw statistically significant conclusions from your analytics. More visits give you more data as well as more revenue, eventually.
In order to get more visits, classic marketing visibility strategies will work. Emails, social media, blog and website embeds are a fail-proof way to put eyeballs on your funnel. If you have the budget, putting your lead page, survey or a shoppable quiz in your ad is also a good idea.
Cure: Go heavy on organic as well as paid channels
2. Diagnosis: Low Clicks
If you’re getting visits, but they are not clicking, you need to take a critical look at the first page of your project. Is your lead page too long? Is your message not clear enough? Can everyone see your call-to-action button without having to scroll down?
By testing different designs and text of your funnel stages, you’ll end up with a high performing beast that converts on every device. Aim for 35% visit to click rate and see how high you can go.
Cure: Test different versions of the first page of your survey, lead page or payment page
3. Diagnosis: Low Completions

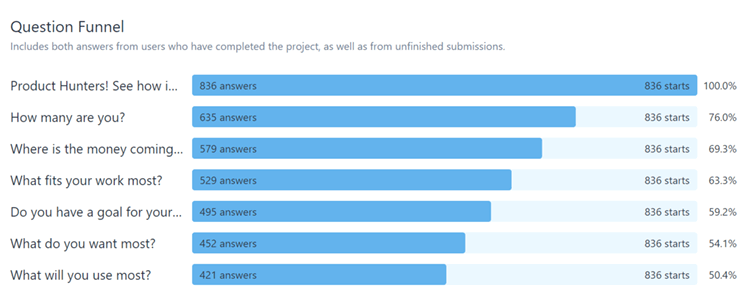
This is an easy one. When your completion rate is below 40%, your project is too long. In Question Funnel, you can see how many leads you loose with each additional question.
Rethink the importance of each question and try to make your survey, lead page or payment form as straight forward as possible. Experimenting with one question per page vs. multiple question pages can also affect your completion rates.
Cure: Shorten your survey, lead page or payment form
4. Diagnosis: Low Leads
Looking back at your Key Metrics, you can see how many leads you’ve generated in Lead Collected. The most important question, you need to ask yourself here is: What’s the main objective of this project?
If you’re just using a survey to redirect visitors to different parts of your website or recommend a specific product, then you’ll collect zero leads and that’s ok. But you’re trying to collect emails, with valid email IDs, and other contact information for your mailing list, sales team or CRM automation, then your survey needs lead capture elements.
Ask for contact information in exchange for an ebook, a free consultation or free templates. Provide value as a reason for people to give you their contact information.
Cure: Offer value in exchange for contact information
5. Diagnosis: Low Payments
Since payments take place at the bottom of your funnel, this is where you’ve typically gathered all the important data about each contact. Use it in your advantage.
88% of shoppers are not happy with the level of personalization they currently receive. This makes it almost too easy to create a better checkout experience than your competitors.
If you want more payments, personalize your payment page. “Your Italian shirt will be shipped on Friday, Josh!” is so much better than “Your order is ready to be shipped.”
Cure: Personalize your payment page by adding Hidden Fields, Logic Jumps, Answer Piping or Multiple Outcomes.
How to Analyze Your Funnel’s Performance?
When looking at your funnel as a whole, there are many tweaks you can make to each step. But you need to know where to find data that guides you towards making the right adjustments.
Detailed Metrics and Analytics is where you find all the important data about each step of your sales funnel - organized and visual. Your conversion rates are already calculated here so you don’t have to do the math.
If you value your sanity, you’re using involve.me for your funnels so you don’t need a developer. This makes it easier to apply any changes as you just drag & drop them and they are live immediately.
It also presents your funnel data in an actionable way, making it easy to test, measure and refine every step.
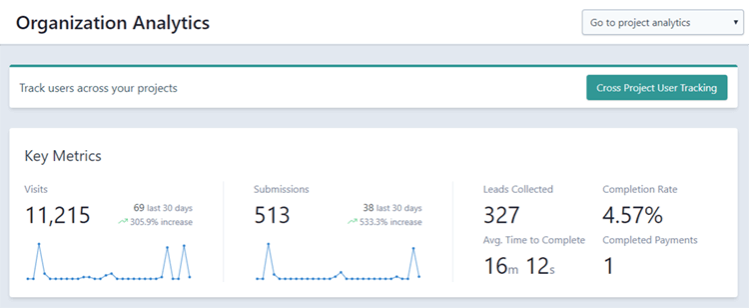
Organization analytics is where you find an overview of all the data collected by your organization, including everyone you’ve invited into your team.
In Key Metrics, you can see all your overall visits, submissions and leads in the last 30 days, as well as Completed Payments and Completion Rates.
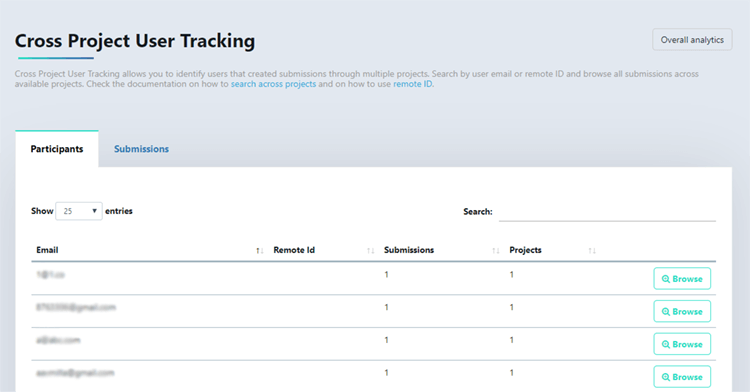
There’s also an option to track submissions across multiple projects with Cross Project User Tracking. This is useful if you’re looking for engaged leads.
Once you Go To Project Analytics, you can look at each step of your funnel individually. You will see Key Metrics for the selected project here, right above Response Summary.
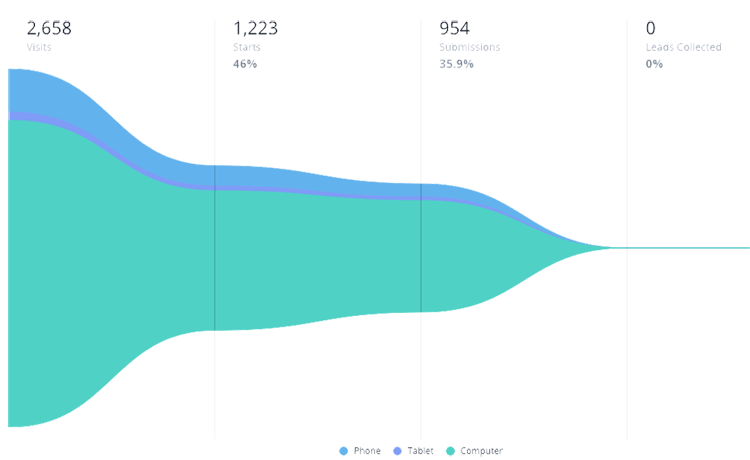
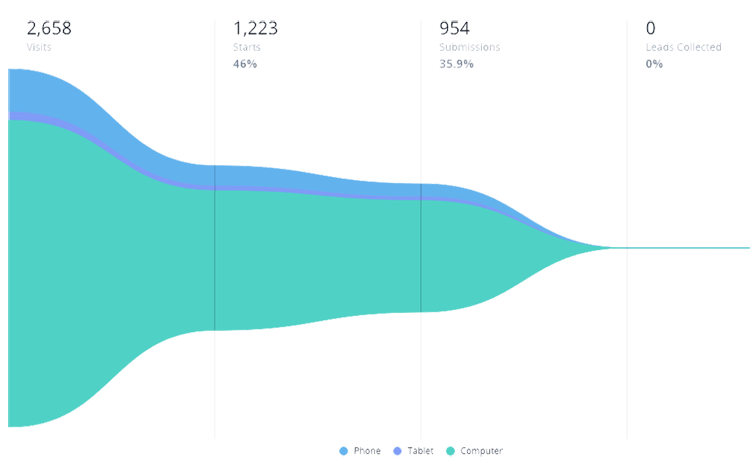
The Detailed Metrics tab is where you can visualize your funnel. It shows your submission rate, meaning how many people made it through your funnel, which in this case is 35.9%.
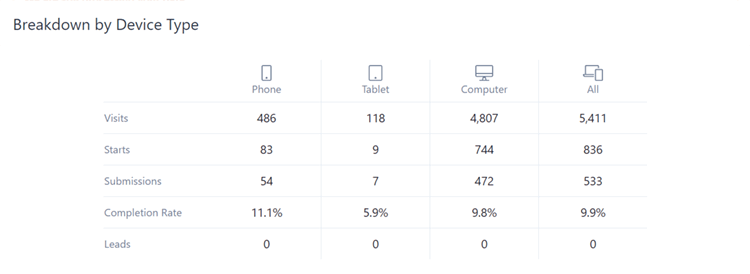
Different colors represent devices that your content is viewed on. Content made with involve.me adjusts automatically to any screen size, but you can take this data and intentionally design your funnel mobile-first if you see you’re getting a lot of mobile visitors and vice versa.
You can see a more detailed device distribution under Detailed metrics on the graph below.
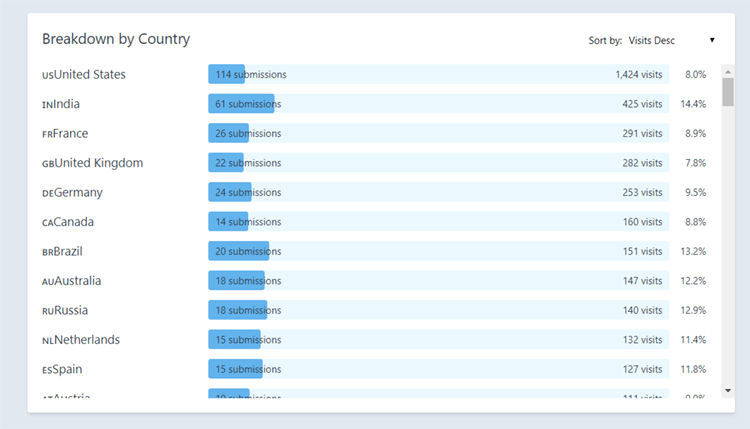
If you’re wondering what countries your audiences are based in, you can see that in Breakdown By Country just below. It shows where your content has been viewed.
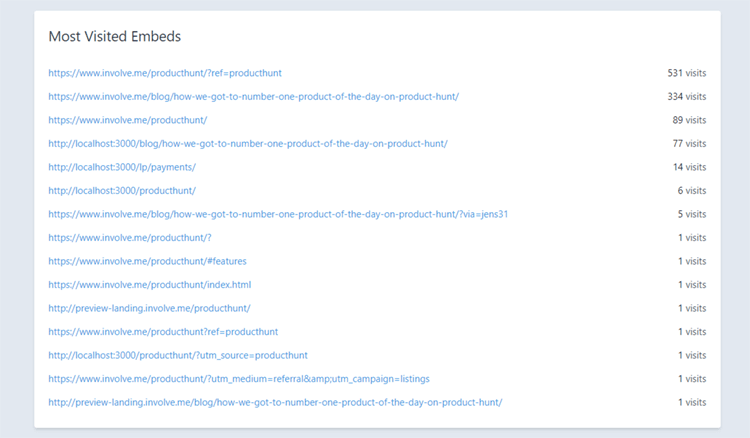
Most Visited Embeds shows you the source of your content’s visits. If you’ve embedded your content into multiple locations like multiple blog posts or web pages you can see which one is bringing you the most visitors. This also works for stand-alone page content as it shows UTMs and referral links.
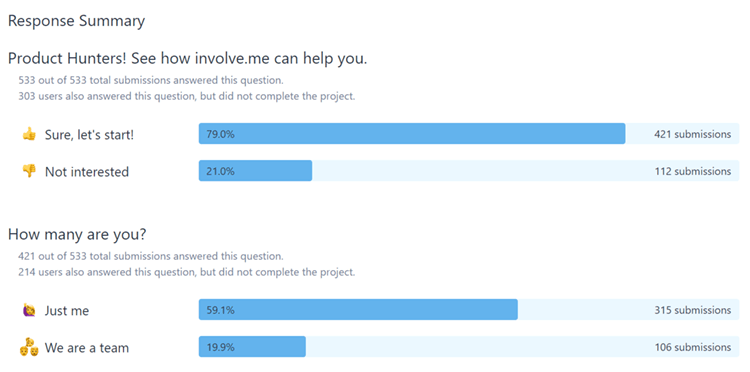
To see most common as well as rarely picked answers, scroll down to Response Summary, where you find response stats. You can see what percentage of visitors picked each answer and how many submissions that is.
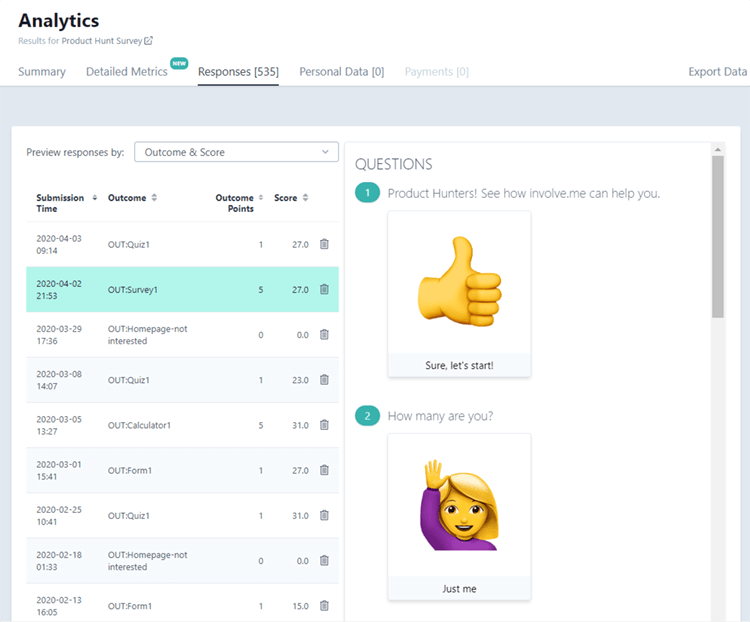
This is especially helpful when you’re trying to understand your audience and define personas. If most of your database ends up picking the same pain point, it’s an obvious data-backed decision to pour more of your resources into it.
Moving on to Responses, here is where you can see what each individual respondent said. You can send this data to your CRM with one of involve.me’s native integration’s or with Zapier for automated segmented follow-ups.
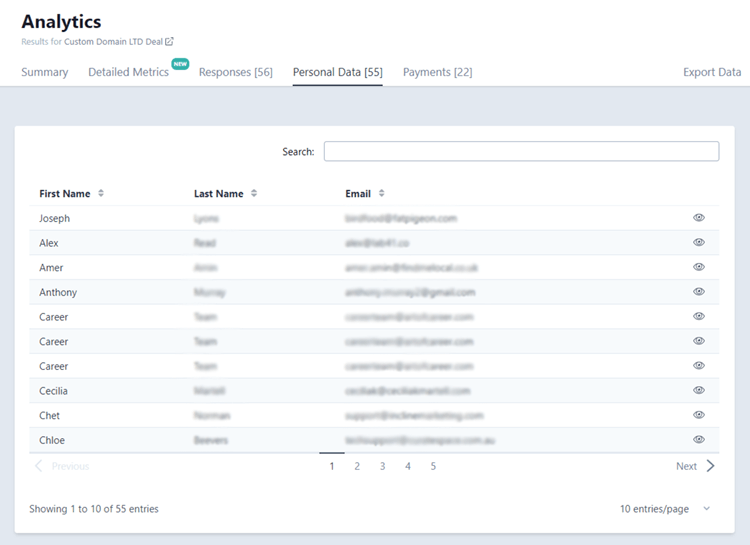
If you just want to quickly get contact information, Personal Data is where you can export it from. It has everything you have included in the Contact Details drag & drop element in your content. Clicking the eye icon will show you the detailed responses of the selected lead.
For a quick look at your payment details, you can go to Payments and see every complete and incomplete payment. Simple tick “Paid” or “Not paid” and choose a submission to display payment details.
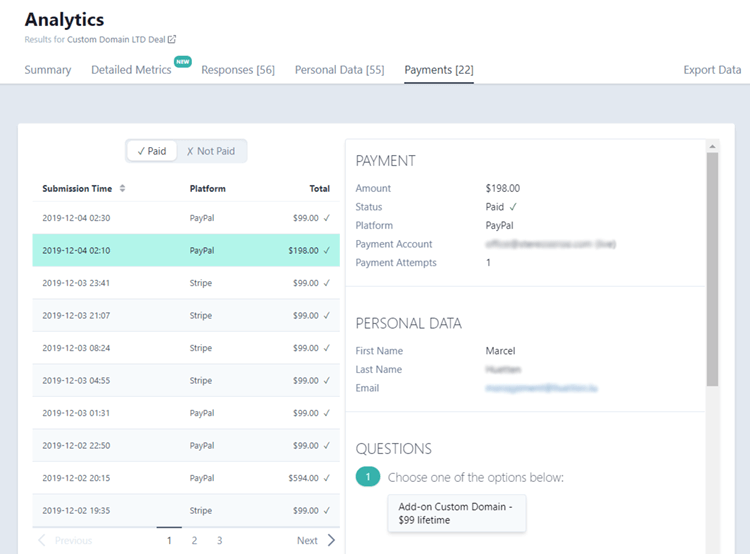
Keep your eye on the “Not paid” submissions, since these visitors did show enough purchase intent to engage with your payment page and might need a gentle push to convert.
Conclusion
Fixing a leaky funnel is easy once you look at each funnel step individually. Knowing each campaign’s objective and what key metrics to keep an eye on is half the struggle.

