Every marketer's dream? Getting more conversions without guessing.
A/B testing on landing pages gives you that edge.
A/B testing is a core practice in digital marketing for improving campaign results. It compares two or more versions of a page, called page variants, to see which one leads to more signups, leads, or sales. Testing different variations of elements like CTA buttons or layouts helps identify what works best.
The process sounds simple, yet it is easy to get wrong. Small mistakes in setup or analysis can waste weeks.
Let’s anchor expectations: the median landing page conversion rate sits around 2.35%, while the top 10% exceed 11.45% across many categories. That spread is your opportunity.
A/B testing is a proven method of conversion optimization, and your job is to move from average to top tier with focused experiments, clean data, and consistent execution.
Let's make your job easier...
What A/B Testing Landing Pages Means?
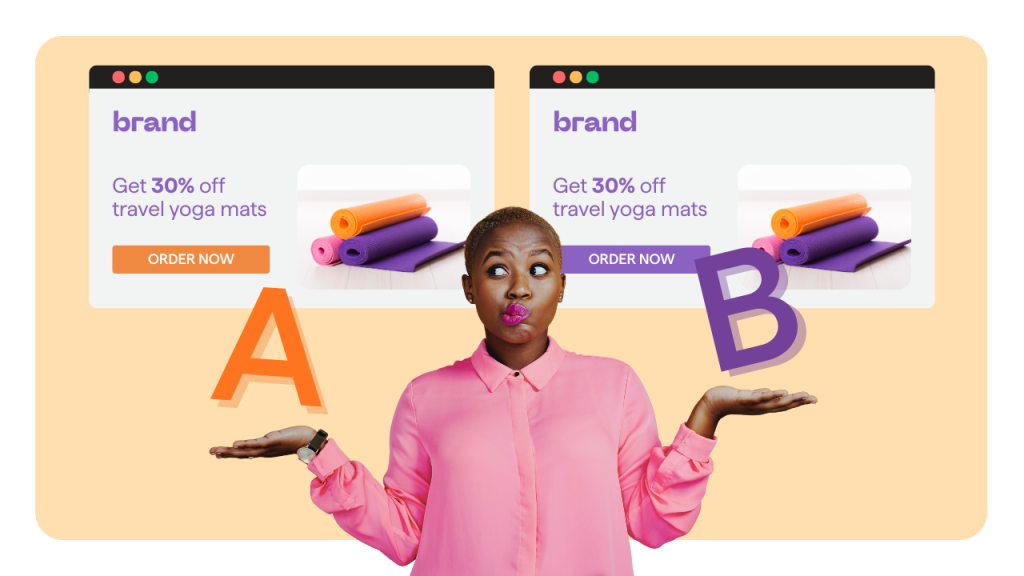
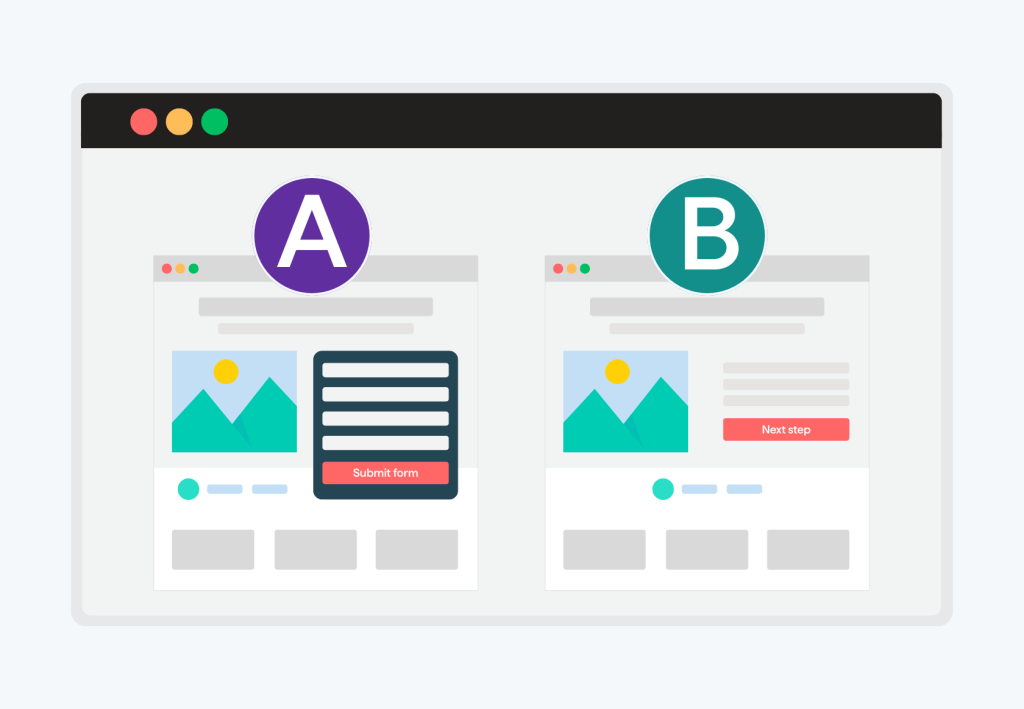
A/B testing, also known as split testing, splits traffic between at least two variants of the same page (A/B testing typically compares two versions at a time).
Version A is the original version, also known as the control page. Version B introduces a change like a headline, form, or offer. You split traffic between the two versions, often 50 and 50, and measure which version drives more conversions.
That result guides what you keep live for 100% of users.
Here is a concrete case: Let's say you run a free trial landing page with a 3% signup rate (That's version A, the original version). For version B, you test a shorter form that removes two fields. You send 10,000 visitors to each variant over two weeks.
If the new form hits 3.6% and the lift is statistically valid, you ship it. If not, you learn and try the next idea.
One number to note here is the baseline 3%, which you will use in power calculations later. Each test should be based on a clear test hypothesis to ensure results are actionable.
Setting Goals and Metrics That Matter
Your goal should be the primary action you want from visitors. For most landing pages, that is a sale, a lead, a trial, a demo request, or form completions.
Then, secondary metrics help explain the primary result. Common ones include bounce rate, click-through to the next step, time on page, and click-through rate for pages where the goal is to drive user engagement through clicks. Avoid vanity metrics like raw pageviews unless they are part of a funnel story.
Make sure to benchmark your expectations. Across industries, the average website conversion rate sits near 2.9%, with mobile averages lower than desktop in broad benchmarks. If your page sits at 1.2%, an aggressive target may be a 20% relative lift to 1.44%. If you start at 4%, a 5% to 10% relative lift might be more realistic. Either way, pick one primary metric and stick to it for each test. Collecting quantitative data is essential to inform your testing and optimization decisions.
In short...
Primary metric: the one outcome you make the decision on.
Guardrail metrics: signals that catch harm like increased bounce or error rate.
Diagnostic metrics: on-page clicks, scroll depth, field interactions, and click-through rates to measure the effectiveness of calls to action.
Set these before you start. That way, you avoid chasing noise later. One guardrail example is keeping the bounce rate within 5% of the control during a test run.
One last thing: It's important to run an A/B test long enough to gather statistically significant results. Don't rush it.
Building Strong Hypotheses and Prioritizing Ideas
Strong hypotheses improve your win rate. But first things first, what's a good hypothesis?
A good hypothesis ties a user problem to a change and a measurable outcome. For example: “Reducing a 7-field form to 4 fields will reduce friction for first-time visitors, increasing trial signups by 10%.” That directional and measurable framing keeps you honest.
Data analysis of past performance and user testing can provide valuable insights for hypothesis development. Use a simple prioritization model to choose what to test first.
The PXL framework, for example, weighs evidence, expected impact, and ease with consistent criteria across ideas. If you have 20 ideas, score each on a 1 to 5 scale for impact and ease, then sort by total score. Start with ideas that score 12 or more out of 15 to get faster learning.
Let's make sure we understand each other here...
Evidence: qualitative insights, analytics, user testing, user preferences as revealed through testing different design or content options, or past experiments that support the idea.
Impact: expected relative change on the primary metric in percent.
Ease: time and effort to design, build, and QA the change.z
When prioritizing, reviewing conversion data from previous tests can help determine which ideas to test next.
Let’s put that to work.
Say you plan to test a customer logo bar, a shorter form, and a new hero headline. If the shorter form has heatmap evidence of drop-off and takes 1 day to ship, it likely ranks higher. Aim to launch your first 3 tests in 14 days to build momentum.
Elements to Test on a Landing Page
We all know that optimizing for higher conversion rates is crucial, but where exactly should you start?
The secret lies in identifying which landing page elements have the most influence on user engagement and decision-making. And the reality is, without well-optimized elements, you risk losing potential customers at critical moments, missing out on conversions, and failing to turn visitors into paying customers.
So stick with me as I break down several key elements you can test to boost the effectiveness of your landing page and drive more conversions:
Headlines: Your headline is often the first impression visitors get of your page! Testing different headlines can reveal which messaging truly grabs attention and keeps users engaged instead of bouncing away. For example, a fitness brand might test "Transform Your Body in 30 Days" versus "Get Fit Fast with Our Proven System" to see which resonates better with their audience.
Calls to Action (CTAs): The wording, color, size, and placement of your CTA buttons can dramatically impact click-through and conversion rates. Don't underestimate the power of testing variations like "Get Started," "Sign Up Free," or "Claim Your Offer." And avoid being too generic. A generic "Submit" button often has less impact than "Unlock My Free Trial". The latter creates urgency and clearly communicates value.
Images and Videos: Visual elements are key for enhancing user engagement and communicating value in seconds. Test different hero images, explainer videos, or product shots to discover what truly resonates with your audience. A software company might test between showing happy customers using their product versus showcasing the actual interface in action.
Opt-in Forms: Interesting fact: the number of form fields, their order, and the information you request can all dramatically affect form submissions. Shorter forms often reduce friction and increase leads, but finding the right balance depends entirely on your specific offer and audience expectations.
Social Proof: Customer testimonials, star ratings, review counts, and trust badges are absolute game-changers for building credibility and reducing hesitation. Test different types and placements of social proof to see what builds the most trust with your visitors. For instance, placing a testimonial right next to your CTA versus featuring it prominently at the top of the page can yield vastly different results.
Countdown Timers: Adding urgency with countdown timers or limited-time offers can be incredibly effective at motivating users to act quickly. But here's the catch: you need to test whether urgency elements actually increase conversions or feel too aggressive for your particular audience. What works for a flash sale might feel pushy for a B2B software trial.
Price Points: The way you present pricing, discounts, or payment options can significantly influence conversion rates. Test different price displays, payment plans, or value propositions to discover what drives more conversions for your business. Consider testing "$99/month" versus "Less than $25 per week" - the psychological impact can be remarkable!
By using split testing or multivariate testing, you can systematically experiment with these landing page elements to discover which combinations deliver the best results for your marketing campaigns. Each test becomes a goldmine of valuable insights into customer behavior, helping you refine your landing pages for maximum impact and ROI.
Remember, optimization is an ongoing journey, not a one-time destination!
Creating Variants for Your Test
Let's dive into the exciting world of creating effective variants.
Ok, it's maybe not that exciting, but it's at the heart of landing page A/B testing!
The process kicks off with your original landing page, which, if you remember, we call the control version. Now, to create a variant, you'll modify just one element (from the list above) while keeping every other aspect of the page exactly the same.
When building variants, always keep your target audience and the specific action you want them to take at the forefront of your mind. Use tools like involve.me, Google Analytics, or specialized A/B testing platforms, to track how each version performs, monitoring crucial metrics such as conversion rates, bounce rates, and user engagement.
Create and A/B tests landing pages with involve.me
Appointment Funnel Template
Whitepaper Download Template
Website ROI Calculator Template
Testing One Variable at a Time: Why and How
Let's dive a little deeper into my emphasis on "just one element" above. This focused approach, which we call single-variable testing, allows you to isolate the effect of that single change on your conversion rates, and trust me, this precision is what makes all the difference!
Now, here's where many businesses mess up: if you change multiple elements at once, it becomes impossible to know which change caused a positive or negative impact on your landing page's performance. By isolating variables, you ensure your test results are statistically significant and actionable, rather than the result of random chance or confounding factors that could mislead your optimization efforts.
Here's a perfect example to illustrate this: if you want to test whether a new headline increases signups, your variant should only differ from the original landing page in that headline text. All other landing page elements, from images to form fields, must remain unchanged. This ensures that any difference in performance between the control and the modified version can be confidently attributed to the headline change, and that's exactly the kind of clear insight you're after!
So, how do you implement this approach? Let me break it down for you:
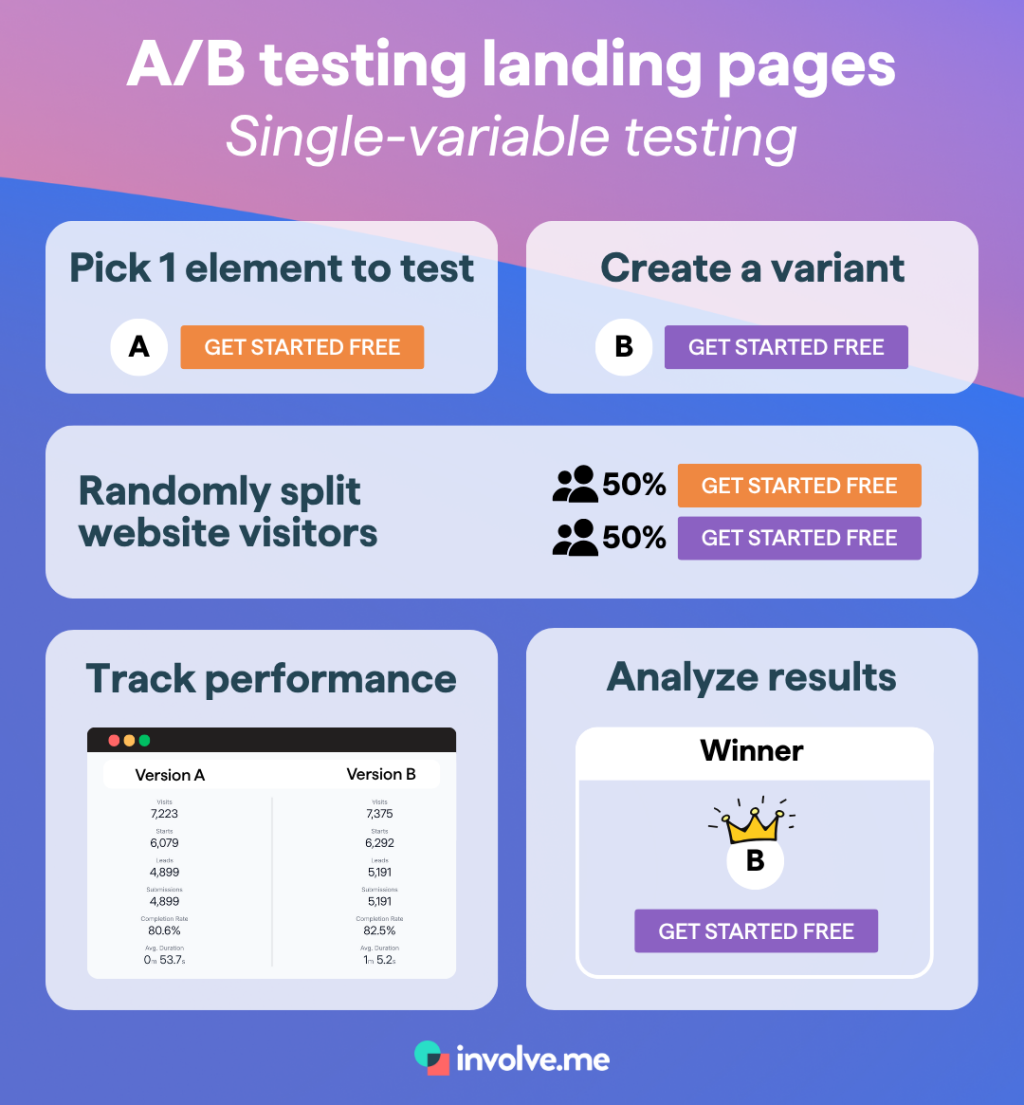
Choose one element to test: for example, the CTA button text that drives your conversions.
Create a variant of your landing page that's identical to the original except for your chosen element.
Randomly split website visitors between the control and the variant to ensure fair testing.
Track performance, focusing on your primary conversion metric.
Analyze the results to determine if the change led to a statistically significant improvement in conversion rates that you can bank on.
This disciplined approach is key for understanding customer behavior, improving user engagement, and making data-driven decisions that steadily boost your landing page conversion rates! Over time, testing one element at a time builds a rock-solid foundation of reliable insights, allowing you to optimize landing pages with confidence and precision that actually moves the needle for your business.
Sample Size, Power, and Test Duration Math
Power and sample size determine if your result is trustworthy.
Quick vocab interruption:
Alpha is the level of risk you are willing to accept that your results will be false positives
Beta is the level of risk you are willing to accept that your results will be false negatives
Power is the likelihood that your A/B test will reveal a real difference between variants (It's usually the result of 100% minus your Beta)
Minimum detectable effect, or MDE, is the smallest relative lift you care to detect. Logically, smaller MDE requires larger samples, while larger MDE can be tested faster.
For references, most teams set Alpha at 5%, Beta at 20% and Power at at 80%.
With a 3% baseline conversion rate, 80% power, 5% alpha, and a 20% relative lift target to 3.6%, you need roughly 100,000 visitors per variant for a classic Z-test of proportions. That order of magnitude comes from a standard sample size formula and aligns with common calculators. If your landing page gets 20,000 sessions per week, a 50 and 50 split yields 10,000 sessions per variant per week. You would need about 10 weeks to hit that sample size.
You can use a statistical significance calculator to determine if your test results are meaningful and statistically valid.
Pick alpha and power before you start.
Use MDE in a percentage that matches the business value.
Calculate duration with your real traffic and conversion rate.
Keep one more rule in mind. Run tests for at least one full business cycle to catch weekday and weekend behavior. Many practitioners recommend a minimum of 2 weeks unless you hit sample size later, which helps reduce false reads from seasonality. If your traffic spikes, recalculate midway and confirm the plan.
Test Setup, QA, and SEO-safe Implementation
Clean execution matters, and hiccups can happen. It's important to plan for it.
For example, a client-side test can cause a flicker effect where users briefly see the control version before the variant applies. That flash can both annoy users and bias results. Prevent this by using a synchronous preloader or a recommended hide snippet to avoid visible changes until the variant is ready. Keep the hide duration short, often under 500 milliseconds.
Running A/B tests should not harm your search performance, as long as you follow search engine guidance. Use 302 redirects for short-term testing, keep page content consistent for crawlers, and use rel=canonical to the original URL when necessary. Do not cloak content or show a different experience to Googlebot than to users. Google has stated that testing is fine within these boundaries since 2012. If your landing pages are only for ads, you can disallow indexing entirely.
Some additional steps to take for smooth A/B tests:
QA (Quality Assurance) variants in at least 3 browsers and on 2 device types.
Validate analytics events for both control and variant.
Check that UTM parameters persist through the funnel.
Confirm that form errors and validation still work.
Verify pixel and tag firing counts on 5 test interactions.
Here is a practical test you can do before launch: run through your lead form with 10 fake submissions on each variant. Confirm that the 20 leads appear in your CRM with the correct variant labels. That avoids messy attribution later.
Running the Test Without Bias
Several things can distort results while a landing page A/B test runs.
For example, peeking at results and stopping early can inflate false positives. This is not subtle.
This can happen with frequentist tests - often the most widely used approach for A/B testing.
In short, a Frequentist A/B test assumes there’s no difference between version A (the control) and version B (the variant). This is the null hypothesis. Then it gathers data and calculates a P-value (the probability value) that tells you how probable your results are if there really is no difference. The smaller the P-Value, the higher the chance that there is actually a difference. Usually, if, at then end of the experiment, the P-value is below a pre-determined threshold (for example 0.05), then you reject the null hypothesis and conclude there is a statistically significant difference.
The issue arises when you start checking data repeatedly and stop as soon as the P-value drops below 0.05, instead of waiting until the end of the experiment. This generates misleading results and can double your actual false positive rate, depending on how often you peek. Make sure to set a stop rule based on pre-defined sample size and duration, and stick to it. No data peeking allowed during the experiment.
You should also make sure to monitor for sample ratio mismatch (SMR). SRM appears when the observed traffic split deviates from your intended 50 - 50 split, more than chance would allow. Causes of SRM include targeting bugs, ad platforms skewing traffic, or instrumentation errors. You can detect SRM with a chi-squared test on allocations and stop the test if it triggers. It is a quick check that saves weeks of bad data. A simple rule is to expect your traffic split to stay within a few percentage points of plan.
In summary:
Lock your stop criteria before day 1 (especially if the Frequentist statistics method is used).
Check SRM and data quality daily at a fixed time.
Keep a change log to avoid mid-test edits.
Be careful, one unnoticed tag change mid-test can invalidate 100% of your data. Assign one owner to approve any change. If anything shifts, pause and restart the test with a fresh sample.
Analyzing Results and Making the Right Call
Primary Metric and Significance
When the test ends, analyze only the preselected primary metric first.
Back to the Frequentist test.
If the P-value is below your alpha threshold, often 0.05, and your guardrails look clean, you have a statistical win. Report the absolute difference and the relative lift. For example, 3.0% to 3.6% is a 0.6 percentage point increase, or a 20% relative lift.
Statistical analysis is essential for interpreting testing results and ensuring you reach statistically significant results that can guide your decisions.
Multiple Comparisons and Corrections
Watch out for the increased risk of false positives with multiple comparisons. If you test three variants against the control, your chance of a false positive increases.
Testing multiple variations or landing page variations requires careful adjustment to maintain the validity of your results. Use a correction method such as Bonferroni to adjust your significance threshold when running many simultaneous comparisons. If you tested A vs B vs C vs D, you would adjust your alpha for each test (remember, this is the level of risk of false positives you are ok with), so that your overall false positive rate stays near your initial alpha.
The Bonferroni correction is done by dividing your original alpha by the number of tests performed.
For example, with an initial alpha of 0.05 and 10 tests, the new significance level for each test would be 0.005 (0.05/10)
In conclusion:
Report absolute and relative differences together.
Show 95% confidence intervals around your estimates. Statistical significance tells you whether the observed differences are likely to be real or due to random chance.
Keep a one-page summary with hypothesis, setup, and decision.
Here is a short example. Your four-arm test shows variant C with a 12% relative lift at P-value = 0.03. After a Bonferroni correction for three comparisons, your adjusted threshold is about 0.0167. Variant C no longer clears that bar. You would call this an indication, not a definitive win, and rerun or confirm with a follow-up test.
Beyond A/B: Bandits and Personalization
Classic A/B tests explore. They maximize learning with a fixed split.
Multi-armed bandits exploit. They shift more traffic to current winners to gain more conversions during the test. Bandits are useful for short-lived campaigns where you have a week or two and care about immediate returns. They are less ideal when long-term learning is your goal.
Personalization assigns experiences by audience traits like device, source, or lifecycle stage. It needs more traffic to each segment to reach power. As a rough guide, each segment should have at least a few thousand visitors per variant over the test period. If your page gets 60,000 sessions per month and you split across 3 segments, that leaves 10,000 per variant per segment at a 50 and 50 split.
Use A/B when you want strong inference and stable learnings.
Use bandits for time-limited promos or when regret matters.
Use personalization when segments have clear intent differences.
One quick filter helps: If a segment represents under 10% of your total traffic and you get 20,000 sessions a month, that is 2,000 sessions monthly. With a 3% baseline, that yields 60 conversions monthly. That volume may be too low for reliable tests in that segment.
Performance, Mobile, and UX Factors That Move Conversion
Speed matters on landing pages. We all know that.
But what's more surprising is how even a small speed gain can have a significant impact.
A Deloitte study across retail and travel found that a 0.1 second site speed improvement led to conversion rate lifts of up to 8.4% for retail and 10.1% for travel in controlled analyses.
Improving Largest Contentful Paint and reducing blocking scripts are practical starting points. Treat speed changes as a separate test or use holdouts if you deploy widely. When optimizing your web page, consider both speed and design elements to maximize user engagement.
Design for the devices your visitors use most.
Mobile now represents the majority of global web traffic, hovering near 59% in recent years. Pay special attention to mobile users, as their behavior and preferences can differ significantly from desktop visitors. This means optimizing navigation, tap targets, and content layout for smaller screens:
Make sure your fold content prioritizes a clear headline, proof, and a single call to action within 600 to 800 pixels on common viewports.
Test tap targets and field inputs for thumbs, not cursors.
To further improve engagement and conversions, experiment with different layouts and page layouts, adjusting the positioning of forms, personalization features, and visual hierarchy.
Compress hero images under 200 kilobytes where possible.
Limit third-party tags to the 5 that add clear value.
Use 16 pixels font size minimum for body copy.
Here is something you can implement today: Move your analytics and tag manager to load after consent, defer noncritical scripts, and switch to a modern image format like WebP. Measure conversion over 14 days before and after. You should see both metrics and Lighthouse scores improve if execution is clean.
Proven Test Ideas with Examples
Some success patterns appear often in landing page experiments: reducing friction in forms, boosting clarity in headlines, adding relevant social proof, and improving visual hierarchy tend to help.
These are not guarantees, though. Each audience reacts differently.
Still, the ideas below are good starting points for most teams. Focusing on the essential elements of your landing page is crucial to maximizing testing effectiveness.
Remove or minimize top navigation on focused lead gen landers. For example, Yuppiechef increased new signups after removing the navigation bar on a landing page in a controlled experiment, reporting a 100% lift in that context (though your mileage will vary by traffic quality and offer).
Clarify headline value: use a simple benefit plus outcome in under 12 words. Optimizing your landing page copy is key for engagement and conversions.
Shorten forms: cut fields to max 4 where possible. Testing form length is a key factor in improving conversion rates. If your form must be long, break it down into multiple steps.
Add proof: customer logos, review counts, or specific outcomes with numbers.
Improve hierarchy: one primary CTA, one secondary action at most.
Reduce distractions: remove nonessential links and carousels.
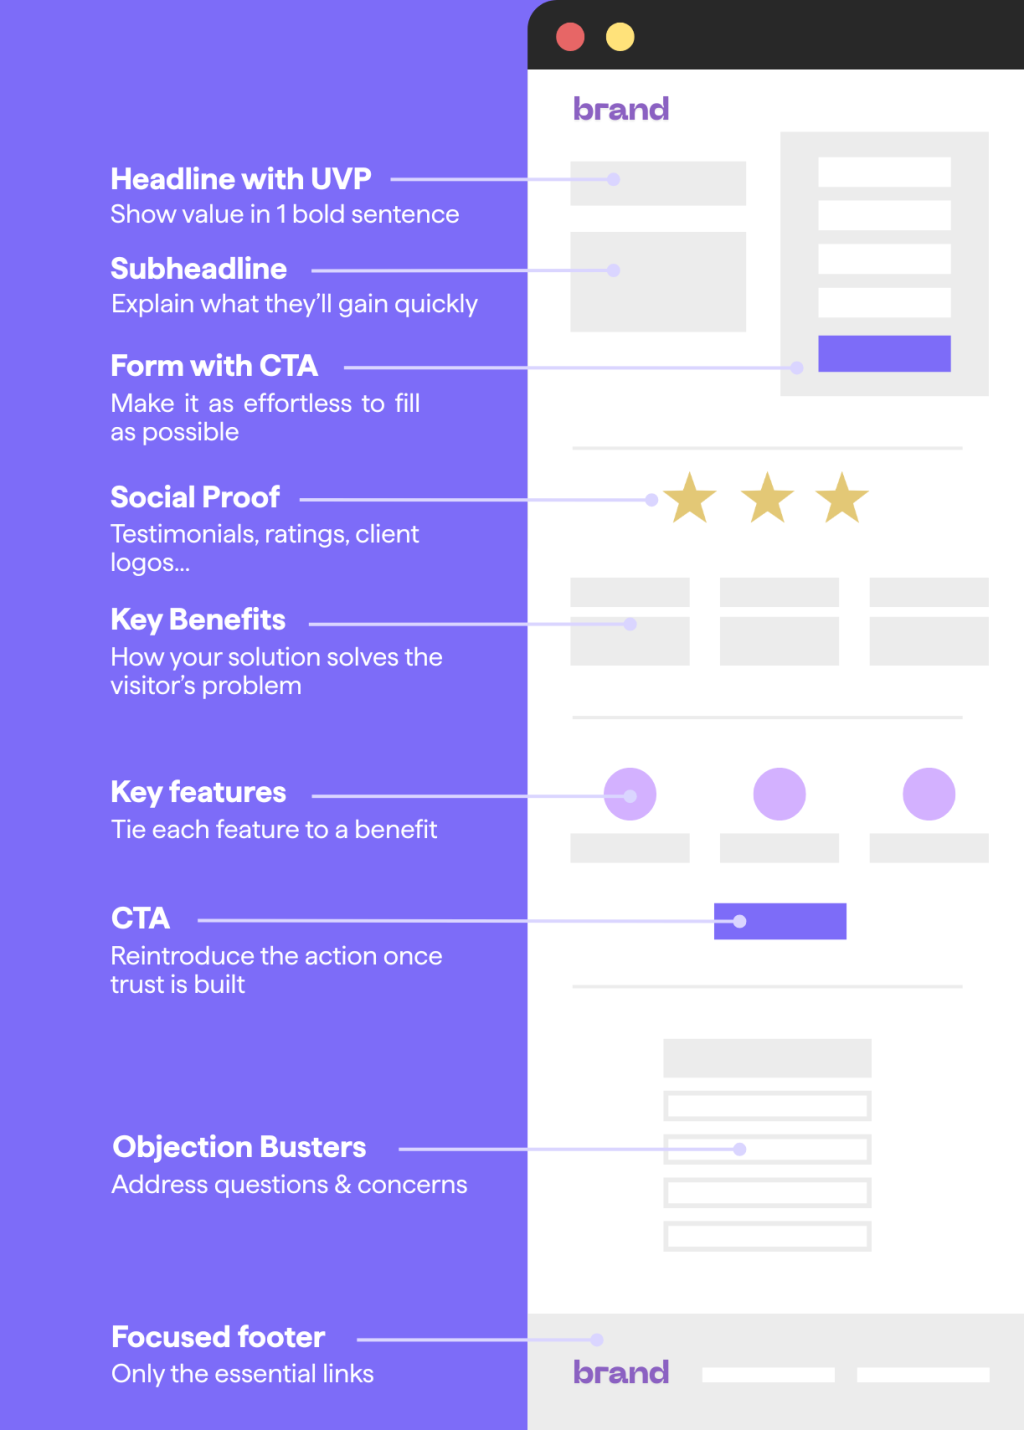
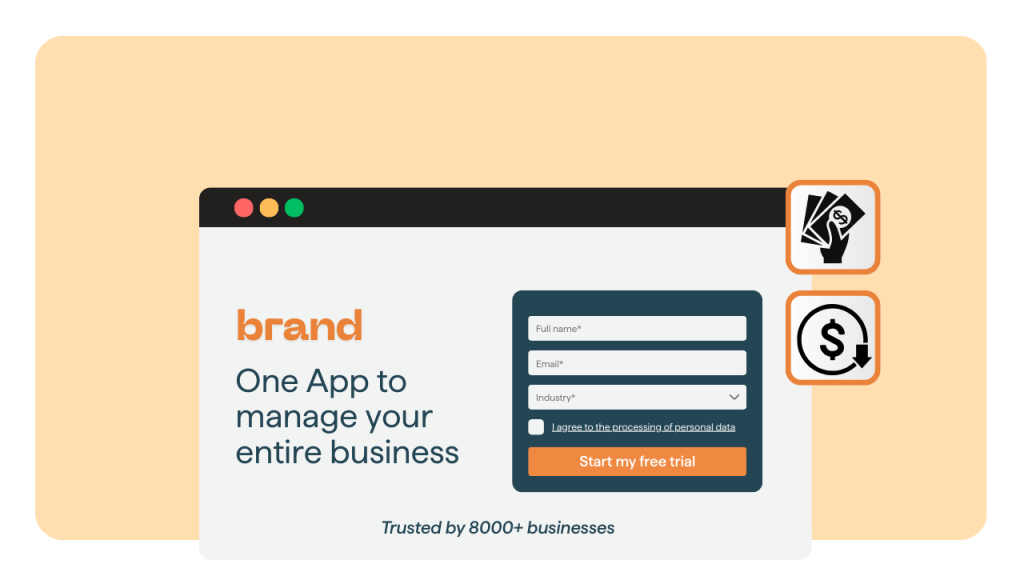
The anatomy of a high-converting landing page
Test these in your context. For example, if your lead form completion sits at 28%, test removing two non-required fields. If that moves to 32%, that is a 14.3% relative lift. Confirm the lead quality stays steady by tracking down-funnel conversion to qualified opportunities. These improvements can positively impact your overall campaign performance.
Driving Paid Traffic to Winning Variants
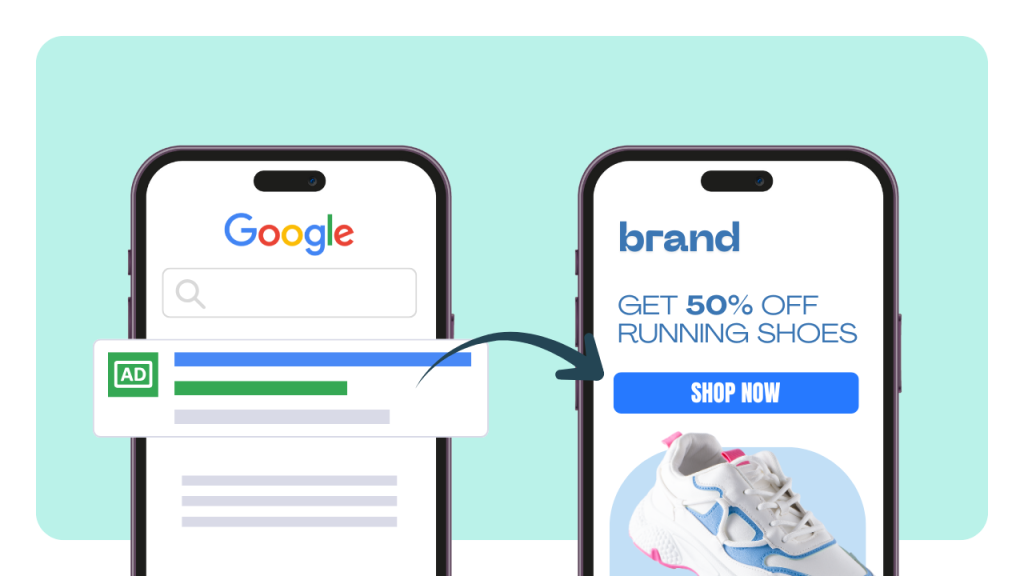
Paid media magnifies the value of valid test results. Send more budget to proven pages and pause underperformers.
Treat your A/B tests as a preflight checklist before scaling a campaign. Before increasing spend, it's crucial to run landing page tests to identify the best-performing variants.
Social media ads are an effective paid channel to drive traffic to your landing page tests, supplementing free sources and ensuring enough data for accurate A/B testing. This feedback loop can shift your customer acquisition cost by 10% to 30% depending on the gap between variants.
Word of caution: keep ad platforms from skewing the test during learning phases. Some platforms run their own experiments, which can cause allocation shifts. To limit bias, avoid changing creatives or budgets during your landing page test. Keep the ad set stable for 14 days, then change only one variable at a time. If you must change budgets by more than 20%, restart the test clock.
Map each ad group to a single landing page variant.
Use consistent UTM parameters across all creatives.
Exclude branded queries if you test for cold traffic performance.
Let's say you run two Google Ads landing pages for a non-brand campaign with a 4% baseline conversion rate. Variant B reaches 4.8%. That 0.8 percentage point gain can lower the cost per lead by 16.7% at the same CPC. Reinvest those savings into higher-intent keywords to drive incremental volume.
Program Cadence, Documentation, and Expected Win Rates
A consistent cadence is important; it builds learning and trust. Aim for a weekly or biweekly launch rhythm, even if some tests run longer.
Encourage your team to regularly run their own tests to foster a culture of experimentation and continuous improvement. Keep a single source of truth for each experiment: hypothesis, screenshots, dates, traffic, metrics, and decisions. This log helps you avoid rerunning the same ideas and keeps institutional knowledge intact.
Set realistic expectations about hit rates. Large companies that run thousands of experiments report that many ideas do not move core metrics. In fact, public sources suggest that only 10% to 20% of experiments at scale deliver positive results, depending on the product and metric mix.
That is normal.
What does it for your team? To get 1 strong win, plan on 5 to 10 tests.
Commit to at least 2 tests per month per key funnel.
Review insights for 30 minutes every week with stakeholders.
Archive failed tests with a one-line lesson to avoid repeats.
For example, if your monthly traffic supports 3 parallel tests, cap your queue at 9 ideas. That keeps the pipeline focused. When planning your test pipeline, use learnings from previous experiments to inform each new test, ensuring that every iteration is purposeful and builds on past results. Aim for each test to ladder up to 1 of your 3 quarterly goals with a clear metric link.
Common Pitfalls and How to Avoid Them
A few recurring common mistakes in A/B testing waste time and erode trust. Stopping on the first sign of green is the most common. Changing traffic sources mid-test comes next. Deploying buggy variants that track conversions incorrectly is also frequent.
Each of these can invalidate results or push you to ship the wrong version. Errors such as false positives (Type I errors) and false negatives (Type II errors) are typical, so proper planning and understanding of statistical principles are essential to avoid these pitfalls.
Use a short checklist to reduce risk:
As explained earlier, commit to no peeking and use power-based duration to fight false positives.
Check sample ratio mismatch to catch skewed splits early.
Run for at least one business cycle to cover weekday and weekend behavior, which often means 2 weeks or longer for landing pages with moderate traffic.
Do not edit variants once the test starts to ensure your split tests remain clean and results valid.
Do not add new traffic sources mid-run.
Do validate analytics and tracking on both arms to maintain the integrity of your split tests.
Do predefine your guardrail thresholds.
Here is one quick diagnostic example. If your intended split is 50 and 50, but you see 57 and 43 after 10,000 visitors, run an SRM check. If it flags an allocation issue, pause and investigate your router, geo targeting, or ad settings. Fix first, then restart with a clean slate.
Turning Winners into Durable Gains
Shipping a winner is the start, not the end.
Keep monitoring the deployed winning variation for at least 2 to 4 weeks. Watch for novelty effects, regression to the mean, or seasonal swings. If you see performance drop 10% from the experiment result, consider a follow-up test to confirm stability.
Then iterate.
Winners reveal new questions. If a short form wins, test the specific field order next. If social proof helps, test the source, count, and placement. Each win seeds two or three new ideas. Aim for 1 follow-up test per winner within 30 days to lock in gains and explore the edges.
Consider running a multivariate test to examine multiple variables at once, especially when you want to understand how different elements interact together.
Deploy behind a feature flag to roll back quickly if needed.
Retest critical changes every 6 to 12 months as audiences shift.
Share outcomes and screenshots in a monthly 30-minute review.
A final example... Your headline test produced a 12% relative lift. You ship it to 100% of traffic and monitor for 21 days. The lift holds at 9% relative. You now test adding quantified proof in the subhead. That systematic loop compounds gains over quarters, not days.
To Sum Up
You just walked through the full A/B testing workflow for landing pages, from hypothesis to rollout.
Stay focused on your primary metric, plan your sample size, and resist shortcuts that twist data.
Use benchmarks as sanity checks, then trust your own test results.
Keep your cadence steady, document everything, and expect that 1 out of 5 tests may win.
When running your first landing page test, apply these principles. Identify the winning variation, consider testing multiple variables, and use multivariate tests when appropriate.
That is how you drive conversion rates from the 2.35% median toward the top 10% threshold of 11% plus over time when the context allows it.
Quickly create and A/B test landing pages
No coding, no hassle, just better conversions.
Resources
What’s a Good Conversion Rate? (It’s Higher Than You Think) - WordStream
E-commerce conversion rate benchmarks – 2025 update - Smart Insights
PXL: A Better Way to Prioritize Your A/B Tests - CXL
Sample Size Calculator - Evan Miller
How Not To Run an A/B Test - Evan Miller
Understanding Minimum Test Duration - VWO
Anti-Flicker Snippets From A/B Testing Tools And Page Speed - DebugBear
Website testing and Google search - Google Search Central
Minimize A/B testing impact in Google Search - Google Search Central
A quick guide to sample ratio mismatch (SRM) - Statsig
Statistical Significance Does Not Equal Validity (or Why You Get Imaginary Lifts) - CXL
Bonferroni correction - Wikipedia
Multi-armed bandit - Optimizely
Milliseconds Make Millions - Deloitte
Desktop vs Mobile vs Tablet Market Share Worldwide - Statcounter
A/B Testing Case Study: Removing Navigation Menu Increased Conversions By 100% - VWO
The Surprising Power of Online Experiments - Harvard Business Review

